Role of the Corporate Executive Officer
Overseeing Management Departments, and Advancing the Strengthening of Management Fundamentals and Reform of the Cost Structure
I am Isao Hirata and I was recently appointed to the newly created position of Head of Corporate Administration as part of the organizational changes implemented in 2017. There are two reasons why this new position was established.
The first is that we have not had centralized management of general affairs, accounting, and other management departments, and it was not clear whether responsibility for reforms of these departments rested with each individual department or with the chief executive officer. To address this situation, we divided the administrative departments into two groups - one for human resources, general affairs, and IT strategies, and another for accounting, finance, and legal affairs – and appointed an executive officer to be in charge of each. On top of that we created the position of Head of Corporate Administration, which I have been appointed to, to bear overall responsibility for the management of administrative departments. We are confident that this new system, by giving us a group-wide perspective on people, non-human resources, finances, information, and other management resources, will allow us to achieve optimal resource usage at a group level and ultimately result in fundamentally stronger management.
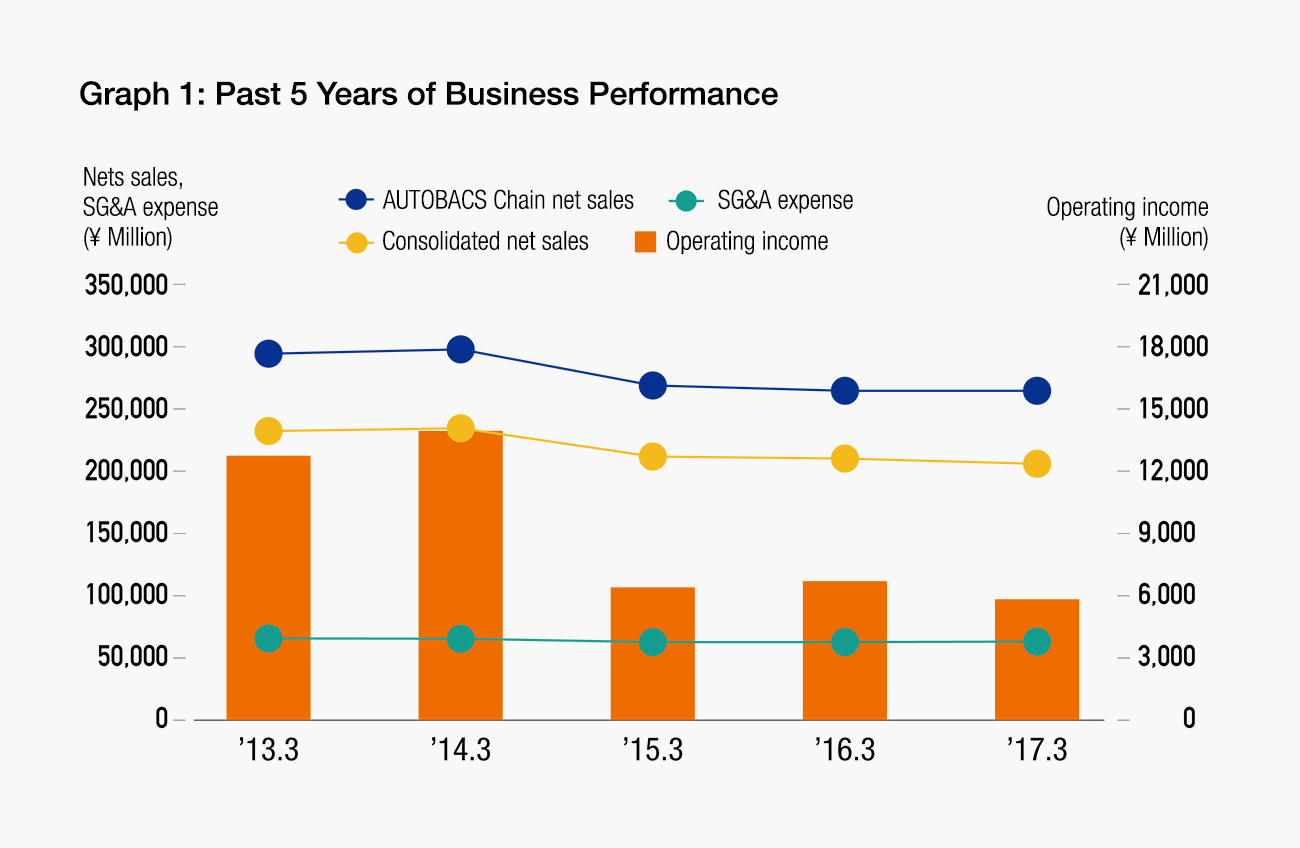
The second reason we created the position of Head of Corporate Administration was to clarify directions to be taken in addressing the Company Group’s perennial issues with regard to reforming earnings and cost structures. A look at our performance over recent years shows that SG&A expenses remaining constant, even as sales have declined, has resulted in a downward trend in operating income (See Graph 1). Restructuring SG&A and other expenses requires a detailed review, and reduction, of expenses that have been regarded as fixed. Furthermore, it is also important for us to change the way we think, so that we are able to emphasize efficiency while satisfying our customers. As the executive officer in charge of administrative departments and the chief financial officer, I am fully aware of the responsibilities I have been entrusted with and will spare no effort in leading initiatives in the areas I have mentioned.
Cost Structure Reform
Increasing Gross Profit and Lowering the SG&A Percentage to Achieve Consolidated Operating Income of ¥12.0 Billion
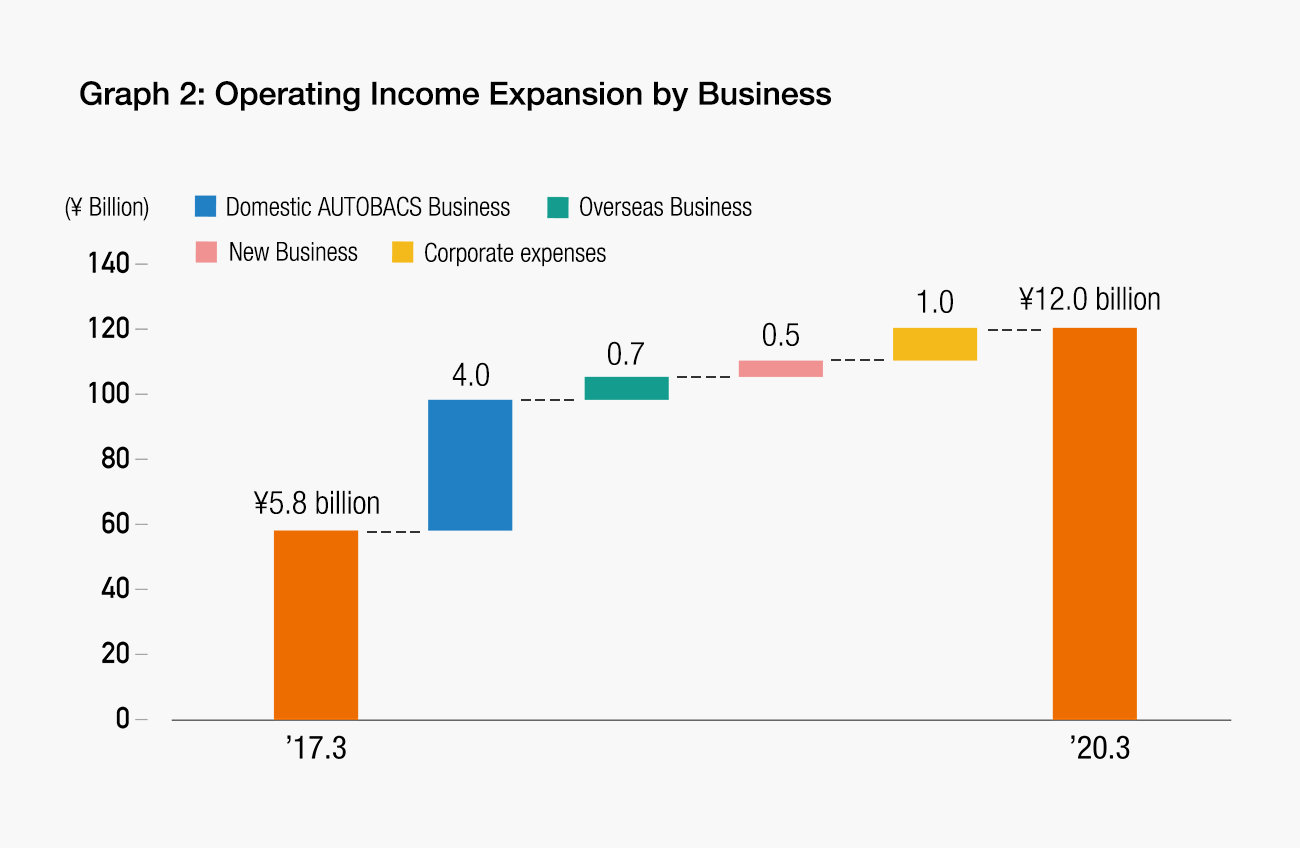
Our 2017 Medium-Term Business Plan calls for the achievement of ¥12.0 billion in consolidated operating income for the fiscal year ending March 2020, the final year covered by the plan.
Efforts to reform the cost structure would be meaningless if they amounted to simple across-the-board cuts that undermined our ability to earn. It is important to cut costs that should be cut but also to spend more when that is warranted. Increasing sales and cutting the cost ratio, through implementation of our growth strategy, will result in higher gross profit. And efficient use of IT and sales-promotion expenditures, together with realignment of human resources to lower the SG&A percentage, will lead to greater operating income for the entire group and a robust corporate organization.
To achieve our objectives, specific quantitative targets have been established for each of our businesses (See Graph 2), and we in the management departments will vigorously advance structural reforms aimed at achieving the targets for each business. Toward that end, we will, of course, collect and analyze the data that will shine a light on current business cost structures and provide the indicators for working out improvement measures. But we will also work from other directions, as well, effectively applying IT, designing a personnel system that promotes the optimal use of human resources, and taking other steps as necessary.
With regard to the management departments themselves, we are planning ¥1.0 billion in expense cuts. We aim to achieve this target as early as possible by undertaking measures such as efficiency initiatives, IT cost reductions, and purchasing reforms.
Increasing Asset and Capital Efficiency
Managing with Emphasis on Asset Efficiency to Achieve a Consolidated ROE of 7.0%
In working to achieve increases in corporate value over the medium-to-long term, AUTOBACS focuses on ROE as an indicator of capital efficiency. Our 2017 Medium-Term Business Plan calls for the achievement of a consolidated ROE of 7.0%, but we see this as simply a checkpoint on the way to double digit ROE in the future.
Earnings growth, resulting from the implementation of growth strategies and cost structure reforms, will be most important in increasing ROE, but it is also essential to monitor how effectively assets are being used. In managing the performance of each of our businesses, therefore, we will refer to ROA as a practical indicator of business profitability and asset usage efficiency, and evaluate our progress based on guidelines including concrete KPIs. ROA targets will differ by business, but the management approach will emphasize asset efficiency, as indicated, for example, by inventory levels and appropriateness of assets, and whether earnings commensurate with investments made and assets applied can be expected. Throughout the group, assets will be reviewed and those that cannot be applied appropriately will be disposed of.
Regarding the capital structure, our aim is to continue with the current level (equity ratio of 70% or higher), while maintaining a sound financial base enabling dynamic financial strategies.
View on Cash Flow and Shareholder Returns
Maintain a High, Stable Level of Dividends While Also Actively Investing for Growth
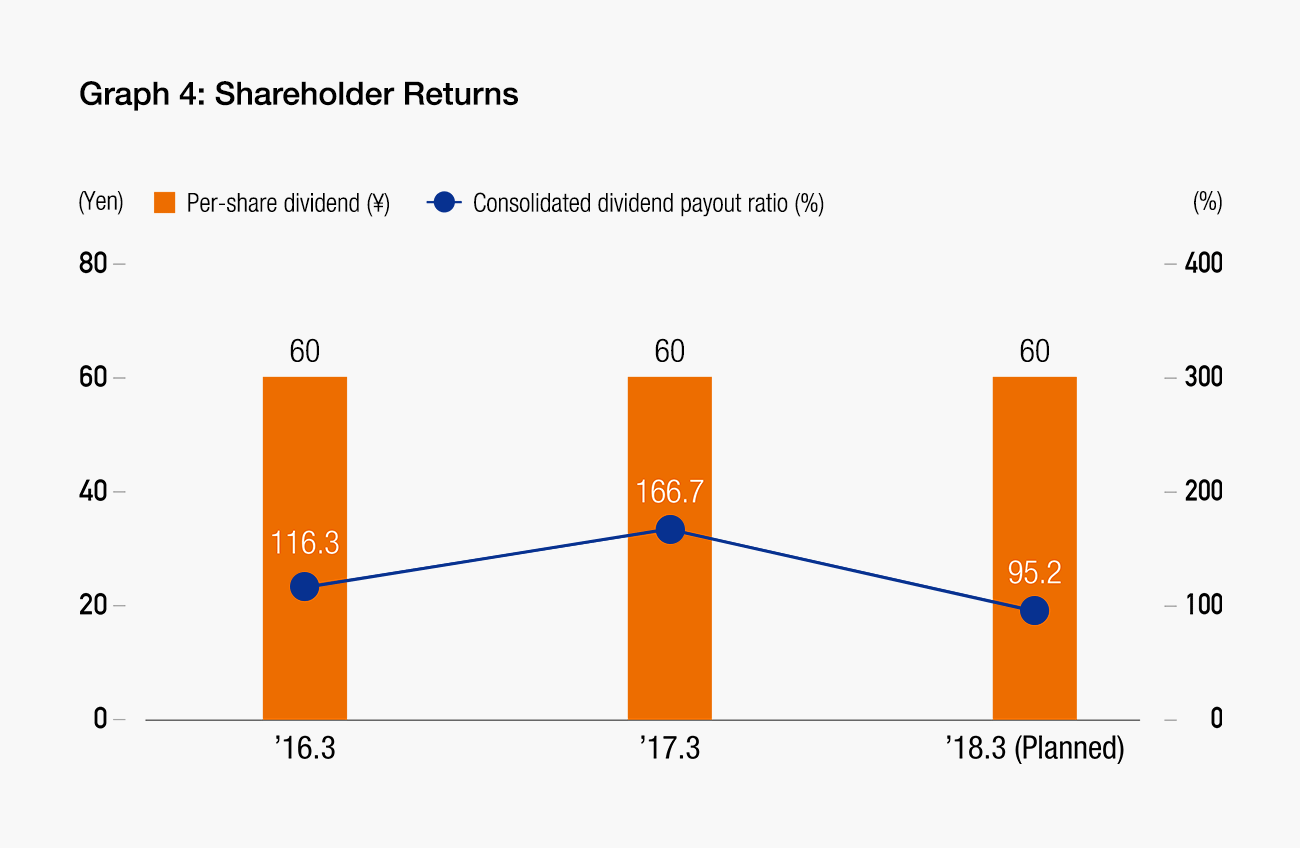
For AUTOBACS, paying returns to shareholders is a top management priority. Our dividend policy has been to maintain a consolidated DOE of 3% or higher. Based on that policy, we set the per-share dividend at ¥60 (DOE of 3.9%) for the fiscal year ended March 2017.
For the fiscal year ending March 2018, the first year covered by the 2017 Medium-Term Business Plan, our basic policy on returns to shareholders is to keep returns at a high level by increasing earnings - in other words, we remain committed to paying a stable dividend. Nevertheless, the policy of maintaining a DOE of 3.0% or higher, included in medium-term business plans adopted beginning in 2008, was established with the intent of keeping dividends at a stable level even as income fluctuated with the implementation of reforms, and using cash on hand as efficiently as possible. Now, with cash on hand lower than in the past, we have decided to adjust our dividend policy to accommodate earnings growth strategies.
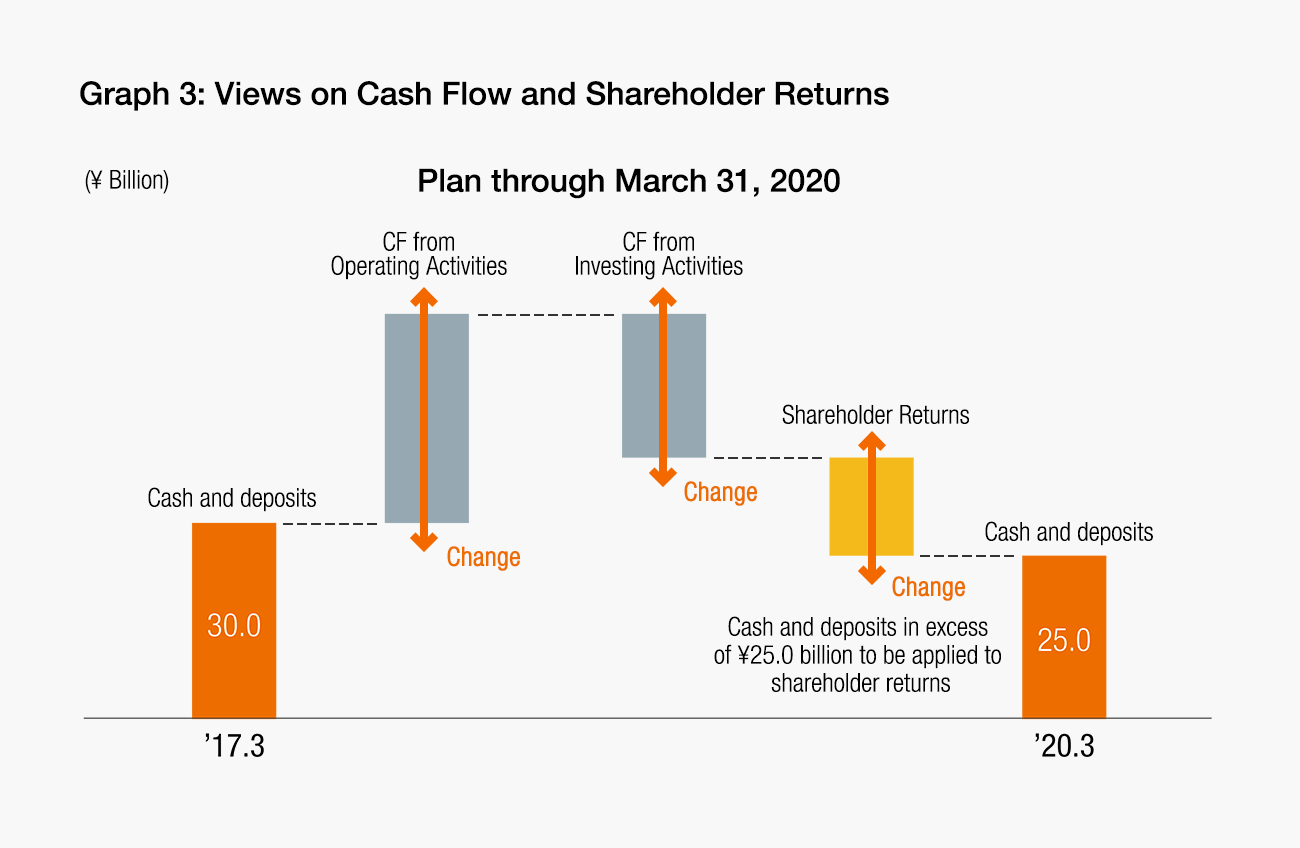
To steadily implement the measures included in the Medium-Term Business Plan, it is imperative that we invest for purposes such as implementing store reforms, developing new businesses, and accelerating overseas business initiatives, and we are planning to make investments totaling approximately ¥21.0 billion over the three fiscal years covered by the Medium-Term Business Plan. A certain level of cash on hand must also be maintained to enable timely M&A undertakings. It is our intent, therefore, to pay shareholder returns from resources consisting of free cash flow - the difference between cash flow from operating activities and cash flow from investing activities – and cash and deposits in excess of ¥25.0 billion, reduced from ¥30.0 billion as a result of efficient capital management (See Graph 3).
Under the new Medium-Term Business Plan, therefore, the indicator for payment of returns to shareholders has been changed from DOE to the consolidated dividend payout ratio, with dividend amounts to be determined, in principle, based on a payout ratio of 50-100% and consideration of business performance. As for purchases of our own shares, these will be conducted as necessary and to the extent permitted by cash flow and liquidity on hand.