

Higher operating income recorded on gross margin and other improvements, despite lower sales caused by a record-breaking warm winter and other factors
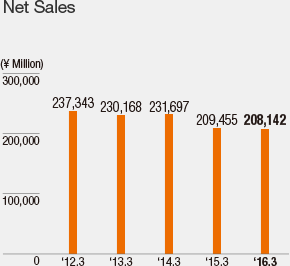
The Company Group finished the fiscal year ending March 31, 2016 with net sales of ¥208.1 billion, down 0.6% year on year, due to a decline in domestic new-car sales and a record-breaking warm winter.
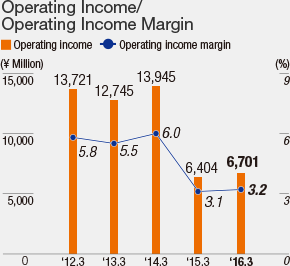
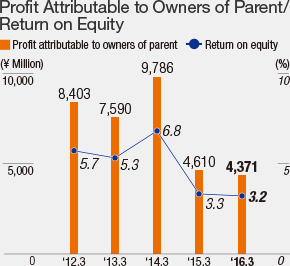
On the earnings front, an improved gross margin made it possible to keep gross profit at about the same level of the year earlier. A year- on-year decline of ¥200 million, or 0.4%, in SG&A expenses, therefore, helped to boost operating income 4.6% to ¥6.7 billion. However, with an extraordinary loss of ¥580 million related to domestic subsidiary stores, profit attributable to owners of parent declined 5.2% to ¥4.3 billion.
Highlights of Financial Results
| AUTOBACS SEVEN Co., Ltd. and Consolidated Subsidiaries Fiscal year ended on March 31 for each displayed year |
Millions of yen |
Thousands of U.S. dollars (Note 1) |
||||
|---|---|---|---|---|---|---|
| 2013 | 2014 | 2015 | 2016 | 2016 | ||
|
Fiscal Year: |
||||||
| Net sales | ¥230,168 | ¥231,697 | ¥209,455 | ¥208,142 | $1,841,965 | |
| Wholesale | 131,859 | 132,733 | 124,279 | 117,848 | 1,042,903 | |
| Retail | 94,770 | 95,540 | 82,039 | 87,310 | 772,655 | |
| Others | 3,539 | 3,422 | 3,136 | 2,984 | 26,407 | |
| Operating income | 12,745 | 13,945 | 6,404 | 6,701 | 59,301 | |
| Income before income taxes and minority interests | 13,915 | 16,086 | 9,053 | 7,558 | 66,885 | |
| Profit attributable to owners of parent | 7,590 | 9,786 | 4,610 | 4,371 | 38,681 | |
| Net cash provided by operating activities | 10,741 | 12,072 | 11,829 | 10,564 | 93,487 | |
| Net cash used in investing activities | (4,522) | 1,519 | (2,403) | (4,984) | (44,106) | |
| Net cash used in financing activities | (14,861) | (11,166) | (12,618) | (11,154) | (98,708) | |
| Free cash flows | 6,219 | 13,591 | 9,426 | 5,580 | 49,381 | |
| Capital expenditures | 6,249 | 4,820 | 6,127 | 5,895 | 52,168 | |
| Depreciation and amortization | 5,194 | 4,551 | 4,805 | 4,012 | 35,504 | |
| At Year-End: | ||||||
| Total assets | ¥205,527 | ¥201,481 | ¥186,532 | ¥180,454 | $1,596,938 | |
| Equity | 142,862 | 143,979 | 138,338 | 131,455 | 1,163,319 | |
| Interest-bearing liabilities | 8,342 | 6,771 | 6,860 | 6,296 | 55,717 | |
| Per Share Data (Yen and Dallors (Note1)): | ||||||
| Basic net income (Note 2) | ¥81.22 | ¥107.71 | ¥52.83 | ¥51.60 | $0.46 | |
| Cash dividends (Note 2) | 52.00 | 64.00 | 60.00 | 60.00 | 0.53 | |
| Dividend payout ratio (%) | 64.0 | 59.4 | 113.6 | 116.3 | — | |
| Dividend on equity (DOE) (%) | 3.4 | 4.1 | 3.7 | 3.8 | — | |
| Total shareholder return ratio (%) | 158.2 | 105.8 | 222.2 | 235.4 | — | |
| Management Indicators: | ||||||
| Operating income margin (%) | 5.5 | 6.0 | 3.1 | 3.2 | ||
| Return on equity (%) | 5.3 | 6.8 | 3.3 | 3.2 | ||
| Return on assets (%) | 3.6 | 4.8 | 2.5 | 2.4 | ||
| Equity ratio (%) | 69.5 | 71.5 | 74.3 | 72.8 | ||
| Non-Financial Data: | ||||||
| Number of domestic stores | 552 | 571 | 584 | 599 | ||
| Domestic stores operated by franchisees | 396 | 415 | 423 | 433 | ||
| Number of overseas stores | 27 | 27 | 27 | 33 | ||
| Overseas stores operated by franchisees | 9 | 10 | 10 | 12 | ||
| Active Members (1,000) (Note 3) | 6,721 | 6,954 | 8,587 | 8,541 | ||
| Number of employees | 4,678 | 4,466 | 4,263 | 4,347 | ||
| Number of automobile mechanics (Note 4) | 3,394 | 3,653 | 3,780 | 3,781 | ||
| Number of directors (of which, outside directors) | 8(3) | 8(3) | 8(3) | 8(3) | ||
| Number of auditors (of which, outside auditors) | 4(3) | 4(3) | 4(3) | 4(3) | ||
| Electricity usage (MW) (Note 5) | 10,646 | 7,515 | 7,097 | 6,810 | ||
| CO2 emissions (t-CO2) (Note 5) | 6,021 | 4,787 | 4,503 | 4,060 | ||
- (Notes)
- 1. U.S. dollar amounts are converted at a rate of ¥113=US$1, which prevailed on March 31, 2016.
- 2. A 3-for-1 stock split was implemented on April 1, 2013. Figures predating this stock split have been adjusted to reflect its impacts.
- 3. Beginning with the fiscal year ended March 31, 2015, “active members” is defined as the number of customers who made a purchase within the past year.
- 4. All chain employees who have obtained the Automobile Mechanic (Level 1, 2, or 3) national qualification.
- 5. Total for AUTOBACS SEVEN Co., Ltd.'s headquarters, regional business locations, directly managed stores, and logistics centers. (Does not include subsidiaries)